Using Amplitude for Product & Web Analytics
By Martijn Scheijbeler Published February 28, 2018I’ve previously published this blog post in Dutch on Webanalisten.nl.
What if you are looking for a product for web analytics but have a lot of events, a complicated product and sending more and more data over time. Sometimes it wouldn’t just work to go with Google Analytics (360), Adobe Analytics and maybe integrating your custom build solution or Snowplow might be too complicated for your organization. In this post I’d like to show you another tool that might be interesting to you: Amplitude. I’ve been working with it for the last year and it provides some great flexibility over other products in the industry.
What is Amplitude?
“Analytics for modern product teams”
Or in normal language, you can track any event and connect that to a user. All the events that you send can have properties, just like the user can have properties. You can filter by all these data points and move your data around to turn it into multiple types of charts: funnels, event hits, revenue, etc. In this article we’ll be running through how you can be using Amplitude and what it’s good for. Let’s go ahead and dive in!
Why would you be using Amplitude?
You want to measure what is happening within your product and what users are doing. Keeping in mind that all this data can help you improve their workflows and measure the impact certain changes have on their behaviour. In that aspect, Amplitude is directly competing with mostly tools outside of web analytics, like: Google Analytics for Firebase, Snowplow, KISSmetrics, Mixpanel, etc. In the next section we’ll explain why, as a lot of features are interpreted differently from regular web analytics but can still help you a lot in your daily work:
What’s the difference?
- Instant Reporting/DIY: While most analytics tools provide you with a lot of pre configured dashboards. Amplitude will let you do this all on your own, which can be a time consuming task but in my opinion it also lets you think a bit more about the way you set-up your analytics infrastructure.
- No default metrics: Bounce rate doesn’t exist as any event can be triggered to influence it (plus, would that be your most useful metric anyway?)
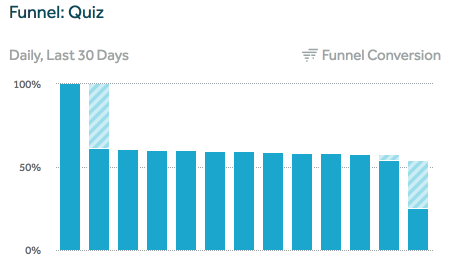
- Funnels: Anything can be a funnel, in my opinion that makes it very powerful as it doesn’t require you to create any predefined goals and also will make sure you can create funnels retroactively (recognize this pain point in Google Analytics?). If you added events a few weeks ago and now is the time to start creating a funnel of it, you’re able to. Want to change the funnel and add more/less events. You can.
- User/Session: Sessions (on Web) don’t really exist in Amplitude. While in my opinion this is a metric that has a very loosely defined definition anyway it can come in handy from time to time to measure retention. It will provide this data on mobile where sessions are way easier to be defined (app open/close).
- Channel/Traffic Source: If you’re looking for an easy way to track where your visitors are coming from with detailed reports that would be associated with costs. That’s just not what Amplitude is for. While it can easily save the UTM data that you’re sending along it won’t offer your great reporting around it. That’s why there focus is mostly on product analytics.
- Merging Events/Linking Events: At the beginning of this section we talked about the need for setting up all the dashboards yourself. As you won’t have a very defined plan with your tracking for what’s to come over the next few years it can be hard to follow a certain naming convention from scratch. Usually turning your analytics data into an unstructured chaos over time. Within Amplitude you’re able to merge certain event names and link them together. So you can easily change your old event names to something new and still connect the data together. One of the features I really miss sometimes in other tools when I’m trying to redefine naming conventions and clean them up.
Why data governance is even more important
The role of data governance is becoming more important by using tools like this in combination with having the need for good documentation. If you come into an organization that is already sending hundreds of different events it can be really hard to get started with making a more deep analysis as you’re not always familiar with the
- Naming conventions: You want to make sure that you’re using the right names for the events and that you’re making sure that their logical in order to send the data. It would be good to give this article, on creating measurement plans, that I wrote for online-behavior.com a read. We’ll talk later about how Amplitude can still help you if you would like to make changes to the events you sent.
- Segments/Cohorts: As most of the data for users can be saved in event or user properties this will also mean that you need to make sure that the data in there doesn’t change too often as it might affect how you’ve set up your segments and cohorts.
- Also funnels and many reports can be impacted by the way you save data.
Overview of features
- Dashboarding/Charts: As we talked about the flexibility that Amplitude can provide you with, this mostly shows in the way you’re working with charts and adding them to dashboards. You can create dozens of different charts and add them to a dashboard. The dashboards will then, for example, give you the ability to change the date range. If you don’t like that you can still make all the changes from the actual chart.
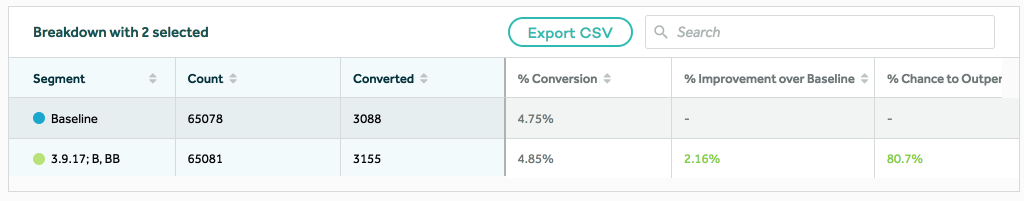
- A/B Testing – Significance Calculator: Are you running an A/B test on your site and sending the data to Amplitude. Within certain charts you can segment out the results and immediately calculate if they’re significant for what you’re analyzing. Saves time trying to find a significance calculator.
- Custom Metrics: Just as many other web analytics tools, Amplitude will give the ability to create custom formulas within a chart to calculate other metrics.
- Retroactive reporting: You have added tracking months ago but only today you’ve figured out that an event should be measure as a goal? You can set up a goal funnel really easily with old data and have all the old data being available to you.
- Realtime: The fact that all of the events that you send to Amplitude are processed in real time makes it very powerful. Basically within minutes of launching a new feature you can start analyzing the data to see what’s going on or if it’s broken. Gone are the times were you need to wait for hours to have all the data that you are collecting be fully available.
- Unlimited event/user properties & ‘dimensions’: Every event can have properties that can be related to the event. In addition to that a user can have properties that can be used too. So if I want to mark certain users with an action I can easily send that along with an event to update the records for this.
- CLTV: Measuring the lifetime value of users will obviously require you to start identifying users (relatively easy to set up). But this will enable you to look into how you’re users are performing over time and if you have high retention for what that means for their customer lifetime value. This is an example report that would provide me with the performance of a segment of users over the last 12 weeks and what they’re worth to the business.
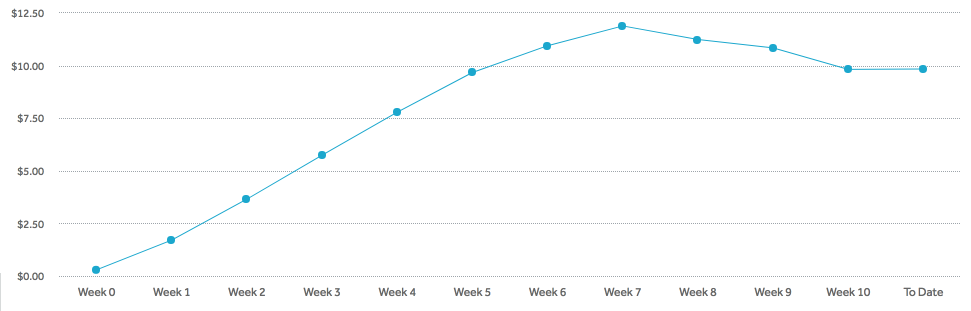
Chart for CLTV
What’s missing?
Google integrations? Obviously some things are missing, while the Cohort feature’ abilities are very powerful and Amplitude can provide you with some cool integrations with other software it still can’t make the connection with the audience data from Google. Which is obviously always going to be a big upside of the Google Analytics Suite.
Transactions/Purchase: The way Amplitude is tracking a conversion is a bit weird. You send all the products that you purchase as different revenue events. There is no concept of a purchase, which seems strange. Also it’s really hard to identify what the Xth purchase was, these are events that you need to setup yourself.
UTM/Traffic Source Reporting: It does exist but it isn’t great and definitely not as powerful as you’re used to in your regular web analytics tools. Does it get the job done for product analytics, Yes it does I’d say. If you’re looking to do anything more advanced with the data you should be building additional capabilities on your own end.
Use Cases
- Funnels: Every event can be part of a funnel and that makes it very flexible and useful if you want to compare user behaviour. For example connecting certain user actions before a purchase funnel can be the case too.
- Customer Lifetime Value/Retention:
- Cohorts: Where you would have segments & audiences in Google Analytics you have the ability to also create cohorts of users to measure the impact of certain properties/events on their behaviour over time. For example this is a cohort that we used often at Postmates where we would look at what users that have come in with the sign up referrer that includes google, yahoo, bing (an organic search user). We would use this cohorts either to export them from other marketing purposes (email/push campaigns) or to analyze their behaviour against other cohorts.
- How do organic search users in the last month behave different if they have used x feature?
- How do users who have touched feature x find the other features?

Segmenting users with its Cohort feature.
Conclusion
Overall I’m pretty satisfied with Amplitude and how it can help you with its flexibility in adding/creating events and figuring out later what kind of dashboarding/charts you’ll create on top of this. But it’s likely (for now) not going to replace most of the data that you’re used to in web analytics as that would require a lot of additional setup and tracking. You can use it very effectively within organizations to track certain aspects and user behaviour. All in all a great addition to most analytics teams. All in all I would advise most companies to use these tools together as they can be very useful in providing more insights into what the user is doing specifically.
If you’ve worked with Amplitude and want to share more about your experiences, leave a comment! Currently I’m working on exporting Amplitude data to Google BigQuery for ‘big data’ analysis, in a future post I hope to share with you on how you can set that up yourself.