Thoughts on building marketing & growth capabilities
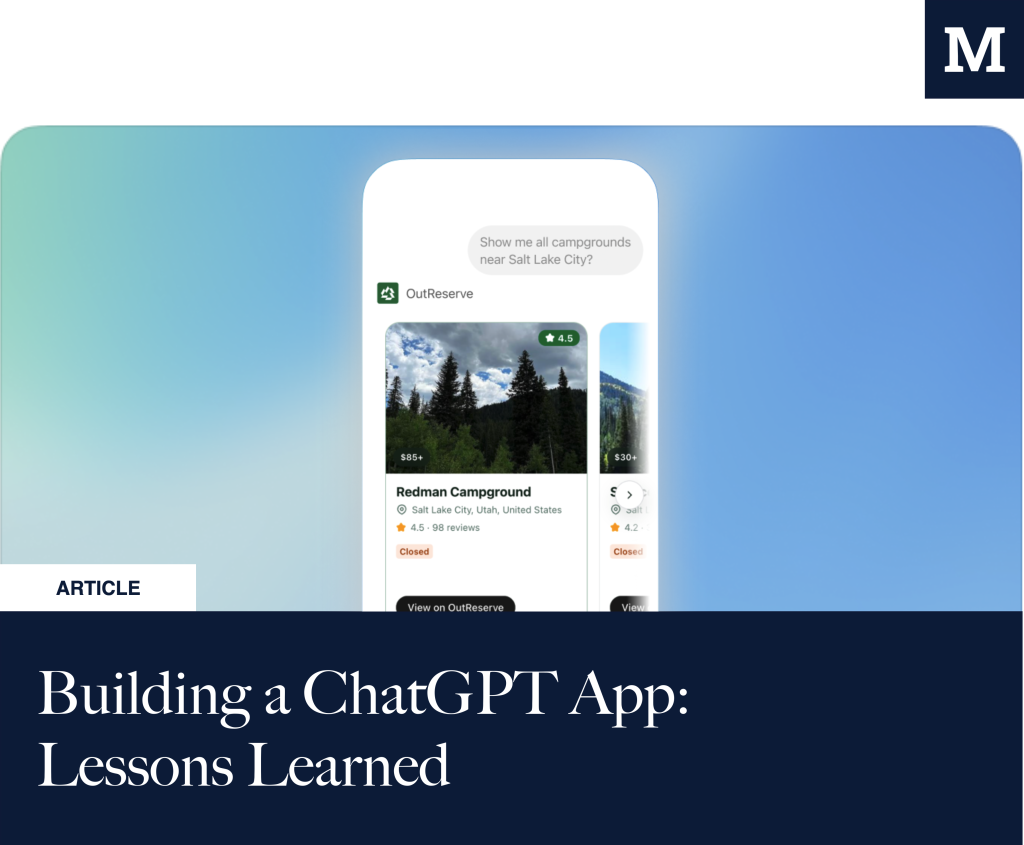
Building a ChatGPT App: Lessons Learned
With the launch of the OutReserve ChatGPT App, we became one of the early adopters of OpenAI’s new framework for bringing external context, data, and interfaces into ChatGPT. My belief is that it will become a massive extension of ChatGPT as a platform. Meanwhile, the types of use cases and interactions are quite different from […]
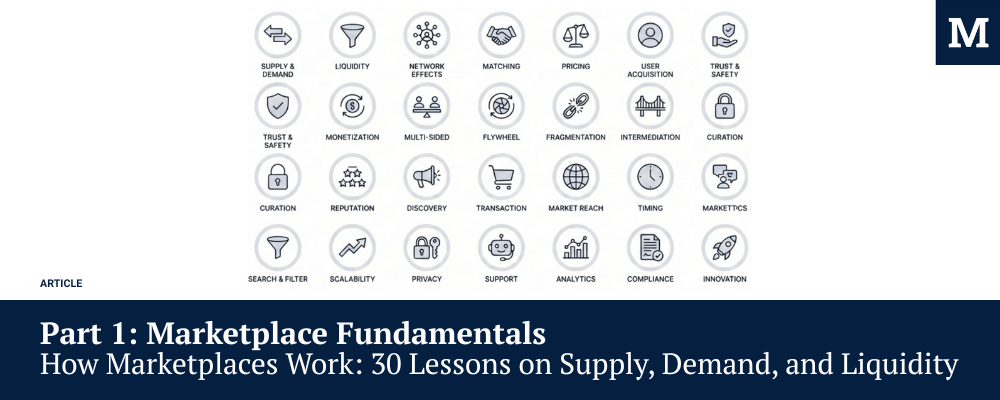
Part 1: Marketplace Fundamentals – How Marketplaces Work: 30 Lessons on Supply, Demand, and Liquidity
Building marketplaces is what drives me. Over the years, I picked up a lot of knowledge about what makes them work and the mistakes I’ve seen (mainly my own). In my previous blog post, I shared my personal insights from my time at RVshare and promised to share more about building marketplaces. There are lessons […]
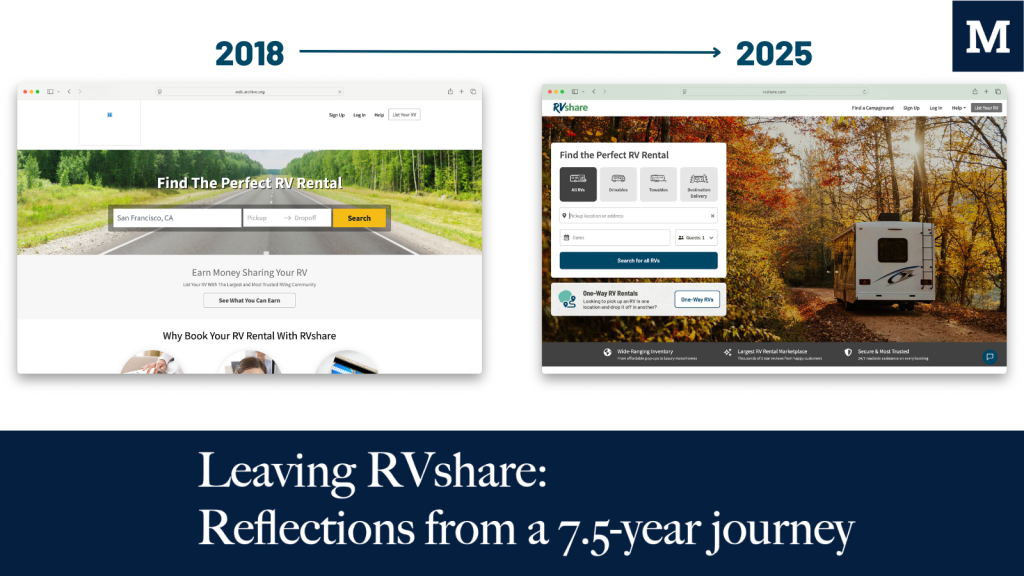
Leaving RVshare: Reflections from a 7.5-year journey
Recapping & reflecting on a 7.5-year journey isn’t easy. It taught so many lessons, and it’ll likely feed new blog posts for a while on a variety of topics (travel, marketing, growth, random anecdotes, and leadership). It started with this relatively generic—but who cares—message in spring 2018. The biggest trigger: ‘Online Marketplace’. Every company I […]
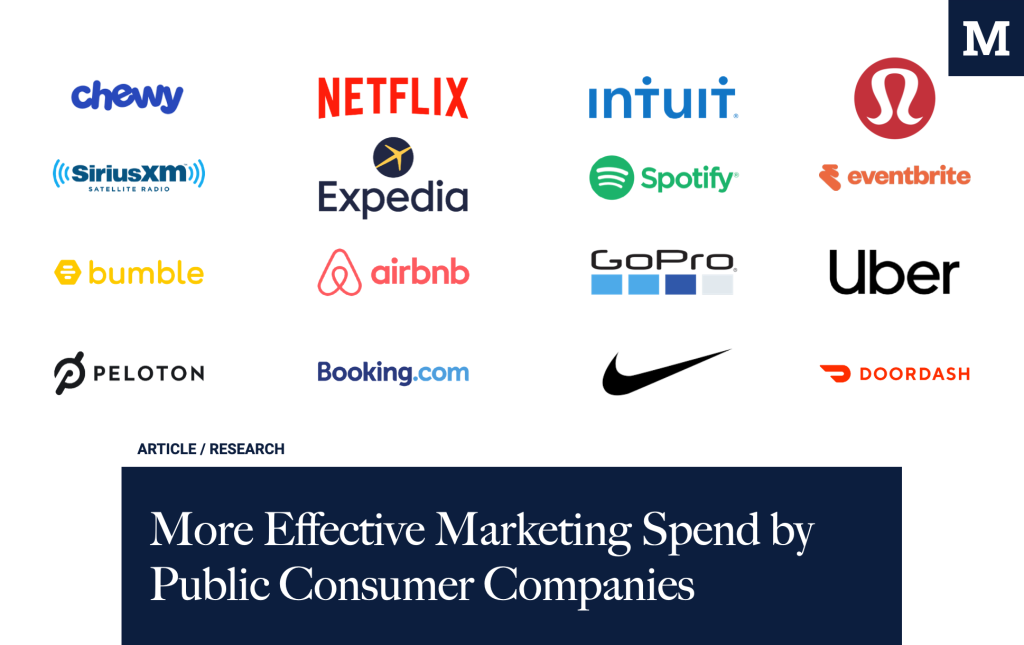
More Effective Marketing Spend by Public Consumer Companies
Two years ago, I evaluated for the first time 20 consumer companies to understand their finances. Marketing & Sales spending as a percentage of revenue or total operating expenses is a useful indicator to show its efficiency in driving incremental revenue (growth). Through the adoption of AI, reorganizations, and a change in consumer spending, I […]
The Role of CMOs in Earnings Calls
“Marketing’s job is to tell the story of growth. Investors just want to know how the next chapter drives the bottom line.” Having ‘a seat at the table’ is an often discussed topic. Only 66 % of Fortune 500 companies currently have an executive with a C‑suite marketing title, up from 63 % the year before [1]. “Only about half […]
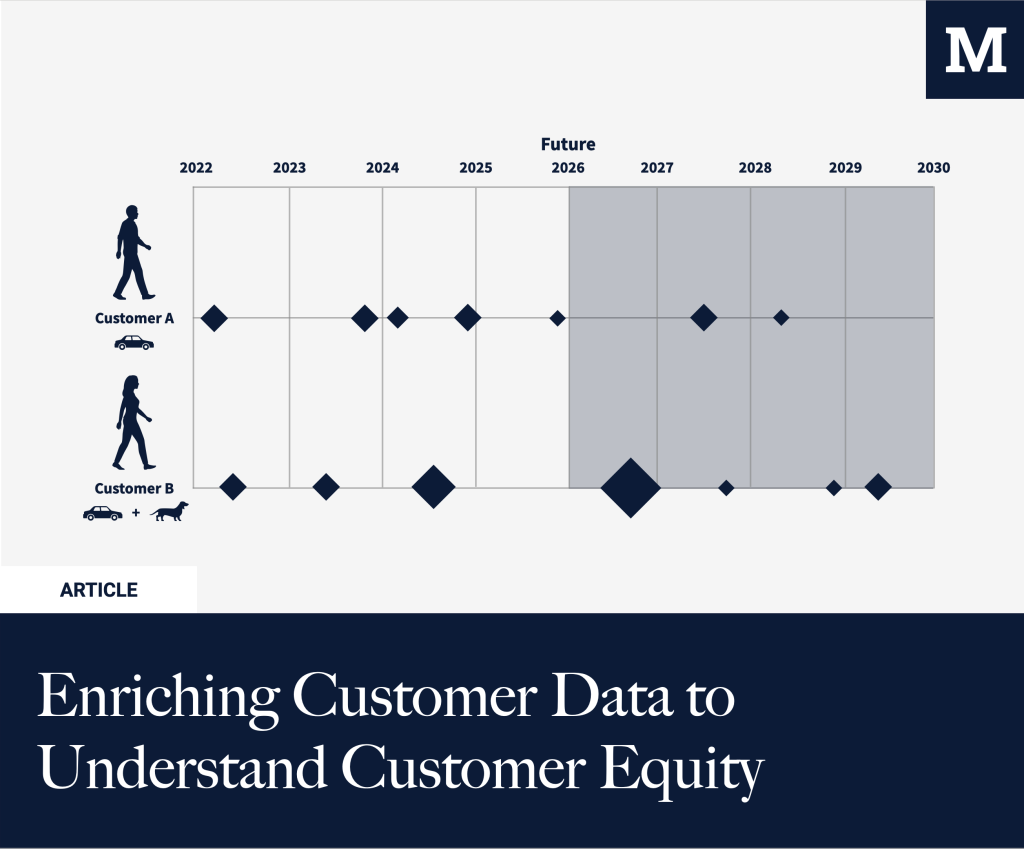
Enriching Customer Data to Understand Customer Equity
Every marketer optimizes for CAC. But what about marginal CAC for your most valuable segment? Understanding who’s your most valuable customer is at the core of customer equity. In B2B, this is situated around understanding the ICP, the Ideal Customer Profile. For B2C, this is often different as there are more SKUs, and margins might […]
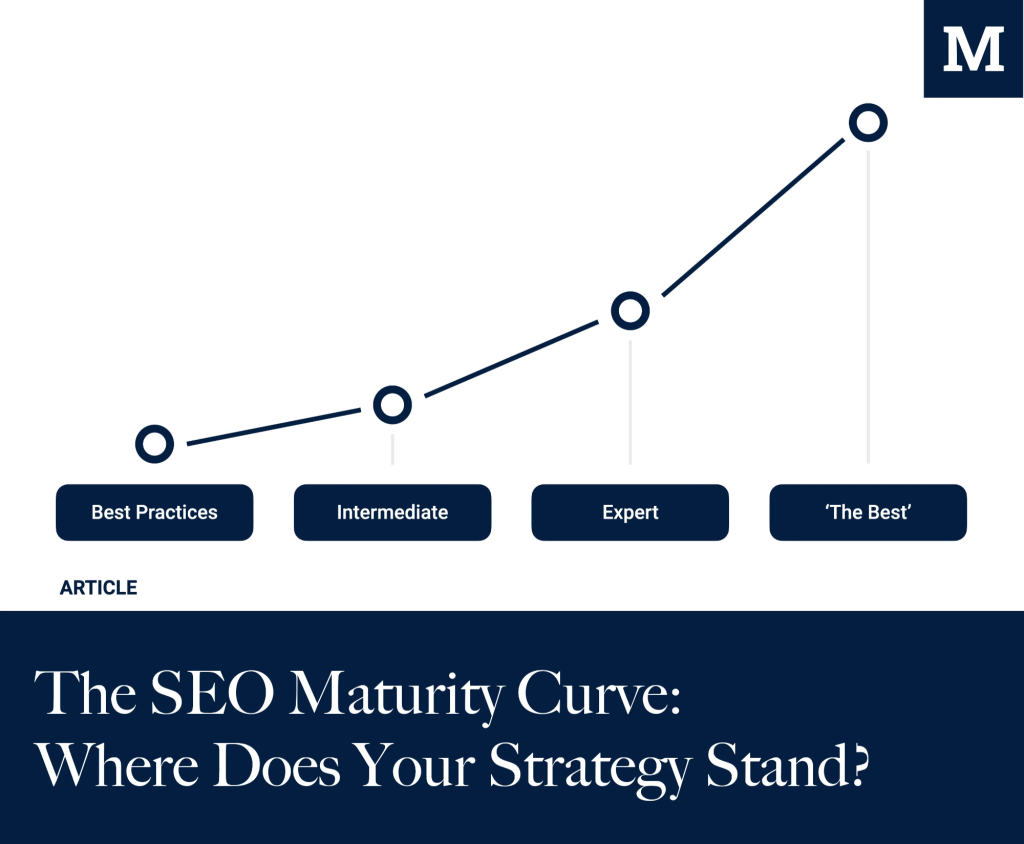
The SEO Maturity Curve: Where Does Your Strategy Stand?
The SEO maturity curve helps you assess where your organization stands. Whether you’re focused on basic optimizations or operating at a fully integrated, C-level-supported, data-driven level. Achieving SEO maturity requires dedicated resources and a relentless commitment to building programs that drive sustainable revenue growth for the long term. While tactical execution fuels success across the […]

What books am I reading in 2025?
“For 2024, I’m committing to reading 20 books again.” – Well, I didn’t make that; some passion projects (more on that later this year) came in the way, and I ended up at only 11. This year, I’m off to a slightly better start, aiming to hit this number. Why am I writing this blog […]
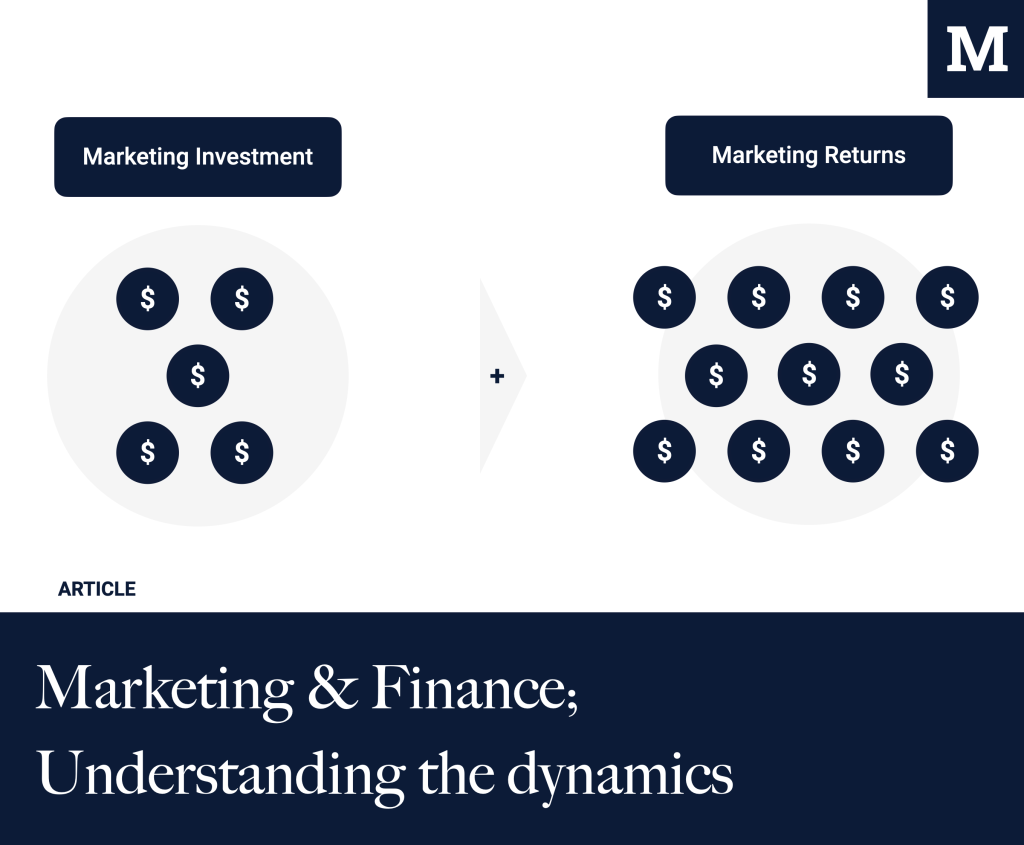
Marketing & Finance; Understanding the dynamics
The best marketing organizations have answers to the following questions: What is your efficiency/effectiveness in Marketing? What is your CAC/CLTV ratio? What is your payback period? What percentage of expenses is acceptable to spend on Sales & Marketing? Should Marketing answer these questions; it should. But can it? It can, when it is supported by Finance. As […]

What books am I reading in 2024?
16 books for 2023, but we also welcomed our son, Lukas, so in the latter half of the year, my pace declined a bit (having to decide between sleeping and reading is quite an easy choice with a newborn). For 2024, I’m committing to reading 20 books again. Why am I writing this blog post? For […]