Marketing Analytics Archives
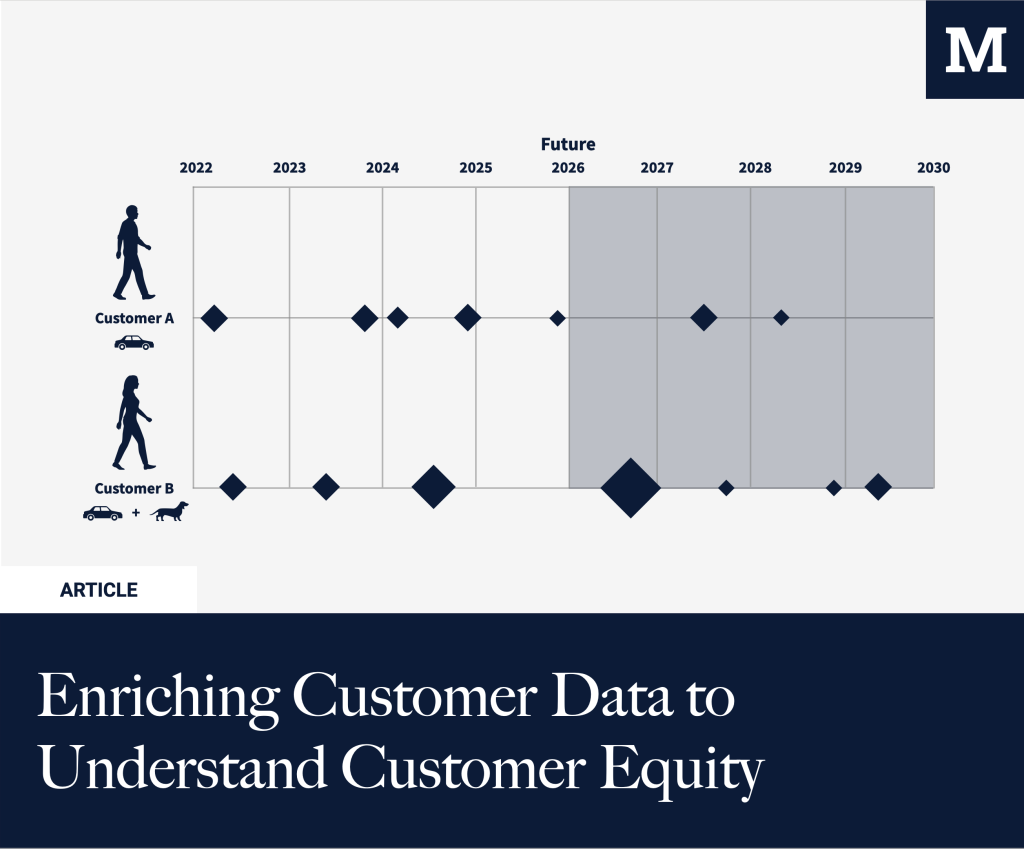
Enriching Customer Data to Understand Customer Equity
Every marketer optimizes for CAC. But what about marginal CAC for your most valuable segment? Understanding who’s your most valuable customer is at the core of customer equity. In B2B, this is situated around understanding the ICP, the Ideal Customer Profile. For B2C, this is often different as there are more SKUs, and margins might […]

Extending our Marketing Data Lake & Warehouse
Marketing Analytics has evolved; it is no longer just ‘web analytics.’ When more marketing budget is spent, you need additional insights that Google Analytics or similar tools can’t offer. That doesn’t mean they have no more reason for existence, but they just become part of a bigger marketing analytics stack instead of relying solely on […]
Assigning Purchases to Other Users in Google Analytics UA
Sometimes, you want to assign specific user interactions to a different user. There are many cases where you want to send an event for user X while user Y performs the action. But it’s important that you can save this information to the right user. In our case, we ran into the use case where […]
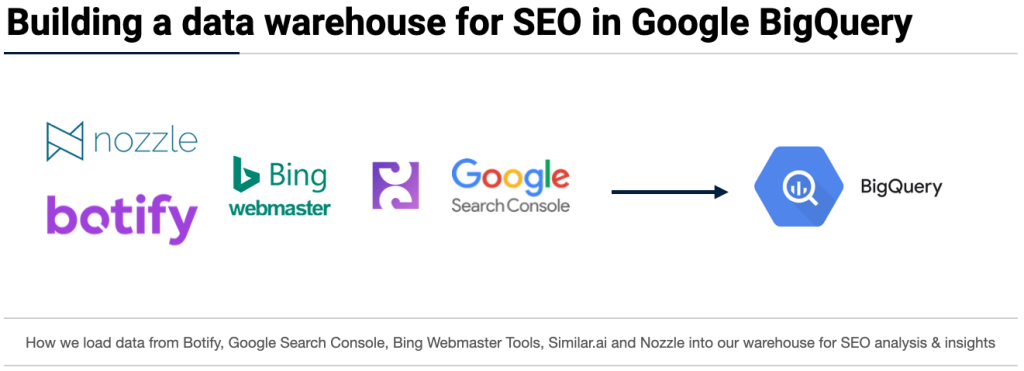
Building a data warehouse for SEO in Google BigQuery
Why do you want/need a data warehouse for SEO? A data warehouse (& data lake) stores and structures data (through data pipelines) and then makes it possible to visualize it. That means it can also be used to help create and power your SEO reporting infrastructure, especially when you’re dealing with lots of different data […]
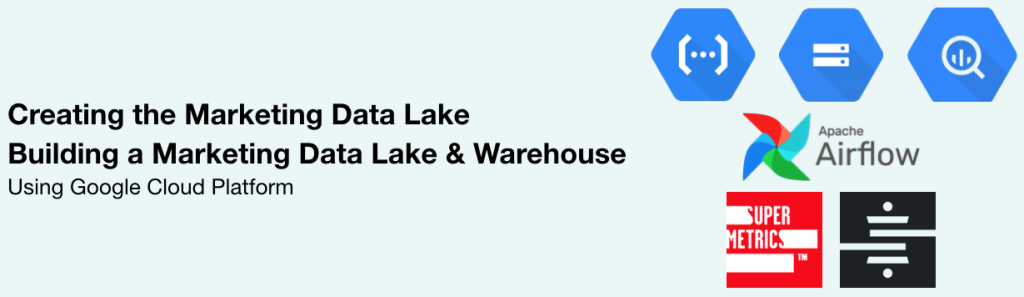
Part 2: Creating the Marketing Data Lake – Building a Marketing Data Lake and Data Warehouse on Google Cloud Platform
In the previous blog post in this series, we talked about why we decided to build a marketing data warehouse. This endeavor started by figuring out how to deal with the first part: building the data lake. We’ll try to go a bit more into detail on how you can do this yourself in this […]