
In the previous blog post in this series, we talked about why we decided to build a marketing data warehouse. This endeavor started by figuring out how to deal with the first part: building the data lake. We’ll try to go a bit more into detail on how you can do this yourself in this post in which we’ll create a marketing data lake. If you’re looking for more inspiration on this topic I would recommend reading this post by the Google Cloud team on how to build a Marketing Datawarehouse. A lot of the thoughts in their article align with our views and the process we followed.
This blog post is part of a series of four? (we found enough content to add more articles ;-)), in which we’ll dive into the details of why we wanted to create a data warehouse, how we created the data lake, how we used the data lake to create a data warehouse. It is written with the help of @RickDronkers and @hu_me / MarketLytics who we’ve worked with alongside during this (ongoing) project.
The Process of Building a Data Lake

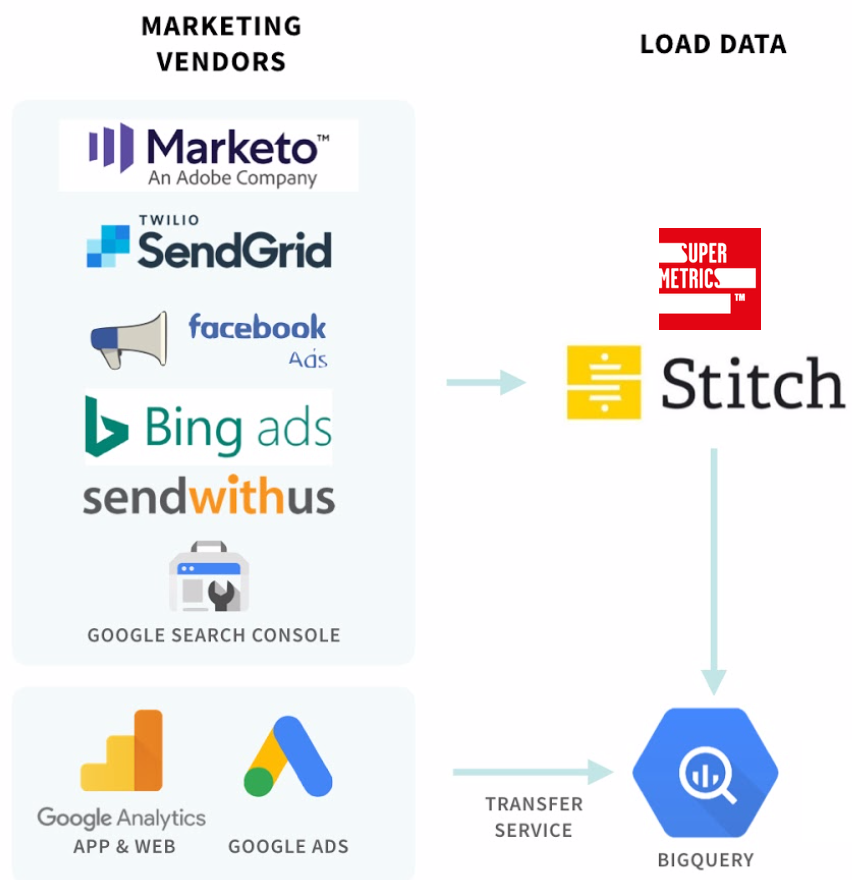
Three Options: BigQuery Transfer Service, Firebase, SuperMetrics, and StitchData
Loading data from a dozen marketing vendors (not all of them are visualized in this graph) as efficiently as possible was important to us as we tried to save most money and resources for other parts of the data warehouse integration. In the end, we believe that we should let people do the jobs that they’re good at and leverage vendors instead of always following a ‘build ourselves’ strategy. This makes it possible for us to focus on the actual use cases instead of having to worry about the upkeep of integrating with over a dozen vendors, something that could/would take up a chunk of time in the long term.
That’s why we made a few decisions on how to load data:
- Firebase: Google Analytics App & Web automatically can export to a BigQuery data set. So we decided to run our regular Universal Analytics integration of Google Analytics in sync with App & Web for now so we have the ability to cheaply export Google Analytics data.
- BigQuery Transfer Service: Google Cloud offers some great integrations for YouTube, Google Ads that can be set up within minutes which makes it possible to instantly backfill and load data.
- StitchData: We decided to go with Stitch as their pricing was more flexible and cheaper for the needs that we had. There are many alternatives to them, but they had integrations with most vendors that we needed. Since we didn’t require Enterprise level SLA’s (yet), we knew that we could rely on their standard integrations with many vendors that we have integrated with.
- SuperMetrics: Some vendors weren’t available at the time in StitchData (Facebook Insights) so we decided to get a license for their BigQuery export.
- ‘Manual Import’: As a last resort we decided to build connections to BigQuery ourselves, so far we only had to do that for 2 vendors which made the workload for this lower than expected.
Understanding platform APIs and Data Granularity
There were over a dozen vendors that we wanted to import data from and in different ways, as described, to load the data into our data lake: Google BigQuery. We needed to ensure upfront that data and platforms that we would be using were up for the task, as some important areas could have thrown problems our way. This was needed to build a good understanding of the platforms and also how we could leverage them. What we looked at:
- Data Freshness & Backfill capabilities: How often would the data refresh and how often would we require a refresh of the data? For some vendors a 24-hour sync was more than enough but for others this meant that a 24-hour sync would last for many hours, basically making yesterday’s data useless as it would take too long. On the other side, we needed to make sure that we could backfill data from vendors and with most decisions on how to load this data that was possible (except for manual backfill, in which case we needed to write scripts that could go back in time to backfill its data).
- Cut time to collecting: Do we need all the data from an API or only partial responses? And in combination with the previous point, do we need to load data hourly (realtime wasn’t much of a case) or could we just gather the data every day to save time collecting it?
- Hard to see all situations beginning end to end: Google Ads exports dozens of tables through their Transfer Service into BigQuery, which meant that it took a while to figure out what tables to use and how certain columns were translated into API fields & tables.
- Using data to find gaps and roadblocks: What worked out for us is that we tried visualizing the data as soon as possible so we could quickly find anomalies (days of data missing due to a broken backfill process), otherwise the data wouldn’t match the interface because metric X turned out to be calculated differently from what we thought.
Associated Costs
- BigQuery Storage: The lowest cost out of all of this, while we store dozens of GBs daily it’s ridiculously cheap to store all of this long-term.
- Stitch: Pricing can be found here. This is really dependent on how much data you’re exporting and from how many sources as you’re billed based on usage.
- SuperMetrics: Pricing can be found here. Basically $190 per vendor monthly.
- BigQuery Transfer Service: This is free for a couple of months for Google Ads export and YouTube. Previously it was $2.50 – one less coffee at Starbucks monthly.
- BigQuery BI Engine Reservation: While it’s not fully related to the data lake I want to add a mention for it. We’re paying $60 monthly for a 2GB size reservation. Currently, we’ve optimized queries as much as possible to be under this limit, if needed we might move up. This has been a game-changer to make querying for dashboarding lightning fast.
Cutting time to prove the value

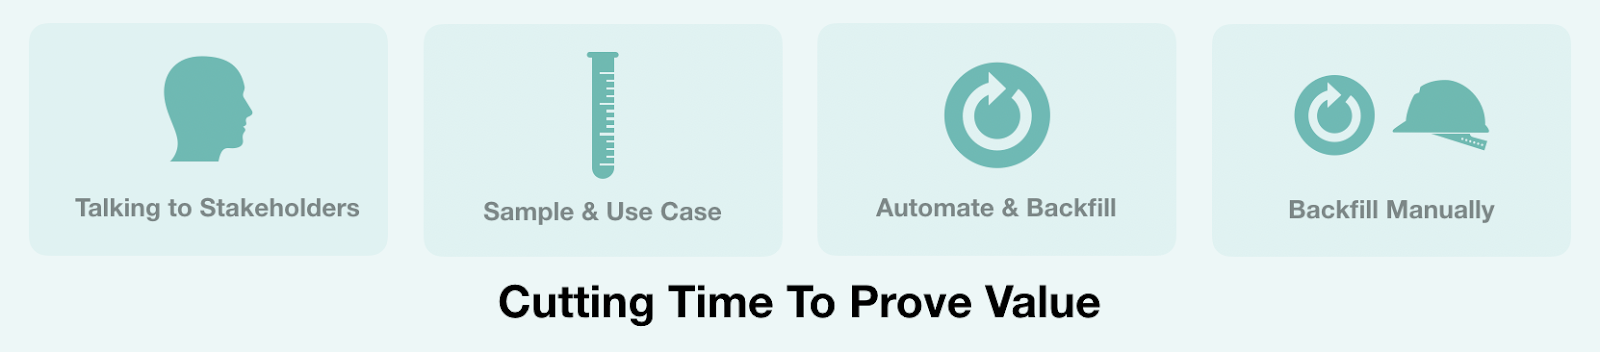
We knew many use cases that we wanted to solve with our data lake, for example: show Google Analytics metrics next to the open, unsubscribe rates from our marketing newsletters (Marketo). This meant that we had the work cut out for us and could quickly take a sample of the data and build out the use case to see if the data could be matched (would we run into tracking issues somewhere, we sometimes did) and what possibilities we had for visualization. In short, we tried to cut as much time out of the initial process as possible, by not focusing on scalability yet, to figure out if the use cases that we had actually could provide value for the teams. Basically thinking about the end goals that we had in mind.
We did that by:
- Talking to end stakeholder – interview & document: The goal of the projects was to, at a minimum, provide every channel owner (PPC, SEO, Social, etc.) with dashboards with their core metrics. That was the basic level that we asked of them to provide, on top of that, we discussed briefly with them all the other use cases that they knew about that they wanted to repeat. By doing this we immediately had documentation on how the process currently worked for them, what data sources were needed to be included and what needed to be built. But more importantly, it also created their buy-in as they were able to pick and choose what we build for them.
- Taking a sample and building a use case: Load the data from the vendor into the data lake and investigate what the schemas were and if the granularity of the data was enough. As long as there was a key in multiple tables that we could leverage between vendors, we knew we were on the right track (examples: UTM tags in emails needed to match with Google Analytics conventions).
- Automate & Backfill later: We never focused on making sure that this could scale over the next years or would backfill our data directly for multiple months at a time. In the end, we noticed that we knew the process was iterative and that we would come up with new use cases which would potentially mean that we had to backfill many times for the same vendors.
- Backfill Manually: Depending on the vendor and type of automation we could put in place, we backfilled some of the data manually where it was needed. Sometimes manually connecting some data points in a database makes more sense when you try to match vendors than it does trying to overcomplicate things in a codebase. We figured this out quickly when we had 50 email templates that we manually needed to map to other data sources.
The (unexpected) problems that we ran into?
Certain things always go differently from the expectations that we set upfront; that’s why I wanted to touch on some of the ‘problems’ that we ran into and how we dealt with it.
Inaccurate data: Dashboard versus Dump
Exports are always different from the data you see in the dashboards, mainly because the information is stored differently from how it’s visualized. For example, Cost data from Google Ads is saved in micro-cents, which means you always have to divide it to get the correct number. CTRs from multiple vendors are just a calculation of Clicks / Impressions. And in some cases, it meant that specific data points aren’t available for export through an API (looking at you Facebook).
Overall this means that you have to assess upfront what data schema is available in export carefully and if this matches the use cases that you want to fulfill. If that’s not the case, sometimes it might not be worth it to try to automate it.
Duplication as a problem in Stitch
StitchData has a different way of exporting data into BigQuery than we were used to. This meant that we had to get used to deduplicating data before we used it for analysis; in short: they created new rows in tables when they notice the unique row has changed. This means that we always needed to find the latest row value for a record. Not a massive problem in itself, but it took us a few days to figure this out as the documentation around this, at the time, lacked.
Backfills
How much useful data do you have available by vendor? As some vendors are very structured: Google Ads have their own transfer service into Google BigQuery, so it was easy to backfill the data here. But for other vendors: Marketo, Sendgrid, it was harder as we made so many changes to professionalize it over time. This meant that for some, we were able to backfill data into 2018, whereas for others, we could barely get data from the last six months. Knowing this upfront is essential as it might make certain use cases irrelevant if you’re trying to learn more from YoY behavior, and it turns out the data isn’t compatible.
Exceptions, for some sources (read Marketo) we had to rely on other solutions. There are limitations to some of the data that we can get out of their (old skool) API. So for some of it, we’re getting daily email reports that are parsed and sometimes ‘manually’ ingested into Google BigQuery. It’s some of the workarounds that we had to do as we would want the data to be accessible through our data lake and some vendors aren’t always as accessible.
Naming Conventions
While we had an early discussion about the naming conventions that we wanted to follow, this was more food for thought than expected. Quickly we had tons of datasets in BigQuery that inside of them followed their conventions (defined by the data load providers). As we were applying ETL on some data tables, it meant that we needed to make sure that it was clear what every table and field in the schema meant. For example, there were tables that were only used: temporarily, for backfill, for production, for development, for transformation, etc. What made it more complicated is that most of them were also individualized by vendor. In our case, we settled on making the distinction between: ‘prod/dev’ + ‘raw/formatted/dashboard’ + ‘tables’ for datasets and then specifying the specific vendor name and goal with the tables in the dataset.
Again… This blog post is written with the help of @RickDronkers and @hu_me / MarketLytics who we’ve worked with alongside during this (ongoing) project.