
Two years ago, I evaluated for the first time 20 consumer companies to understand their finances. Marketing & Sales spending as a percentage of revenue or total operating expenses is a useful indicator to show its efficiency in driving incremental revenue (growth). Through the adoption of AI, reorganizations, and a change in consumer spending, I noticed this also impacts the effectiveness of spending on Marketing in the last couple of years. This hasn’t gone unnoticed by other publications & researchers as well.

A decline in Marketing spending as a % of Revenue and OpEx
The Gartner 2025 CMO Spend Survey indicated that marketing spending is declining as a percentage of revenue but not as an absolute number for most companies. This is essentially what matters, as it means that Marketing spending is potentially yielding more results and being deployed more effectively. However, OnlyCFO reported mere days later: “GTM Efficiency is Plummeting!”, backed by data from Altimeter. It heavily skews towards B2B/Cloud companies, different from the subset that we’ve been looking at, but it is showing an alarming trend that will also have an effect within the consumer space.

Winners versus Losers: Harvesting Efficiency or Growth at all Costs?
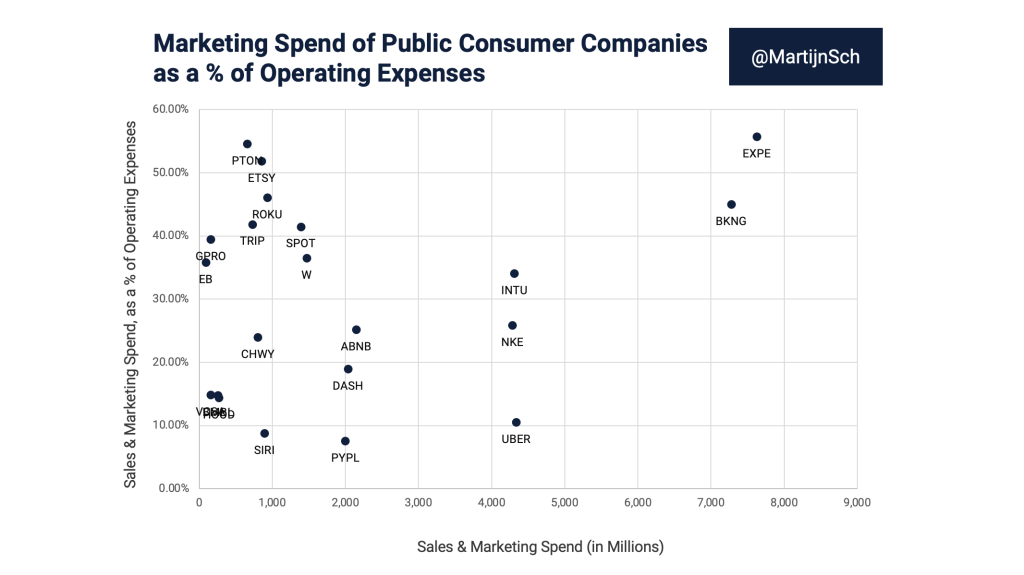
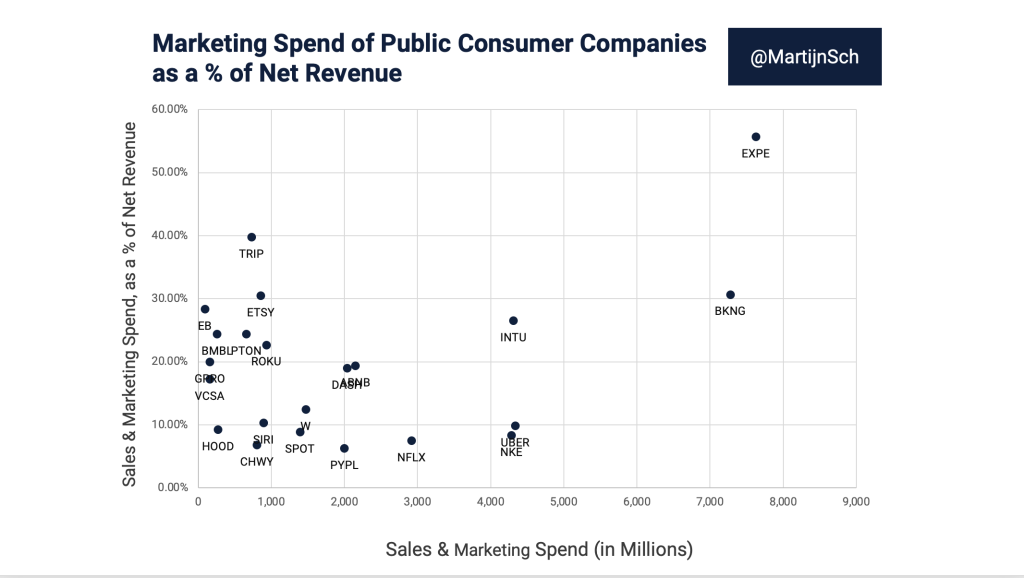
The efficiency graphs for 2024 don’t show that much of a difference compared to the one from two years ago. For the simple reason that most brands don’t have major shifts in their spending and are operating under the regular yearly cadence.
Introducing two new measurements: New Revenue Growth & Efficiency
That’s why it’s becoming more important to look at other ratios that could provide an insight into how efficient additional spending is. If growth is outrunning spending, then we know it’s a worthwhile investment. If a business isn’t doing well, you can learn much more about how it needs to keep investing to keep up its growth or remain stable.
| Definition | How to Calculate | Summary |
|---|---|---|
| Revenue-to-Spend Delta (pts) | (YoY Revenue % – YoY Marketing Spend %) | Are they doing more with less. |
| Marketing $ per Net-New Dollar of Revenue | YoY Marketing $ / (Revenue2024 – Revenue2023) | Who is actually buying growth vs. who is harvesting efficiency. |
- Roku, Spotify, Uber, and others are showing how scale supports efficiency. Many of them increased their marketing spend but saw a significant increase in revenue as well during the same time frame.
- Etsy and Nike both increased their revenue and marketing spending in the past year. Was it all efficient, though? Both had to spend more than a dollar (Nike $1.55, Etsy $1.62) to increase revenue by a dollar. Obviously, the real answer is not in the public data, but it does raise the question of whether the (short-term) investment was worth it. Mark Ritson and others have blogged about: Four big strategic mistakes Nike needs to reverse.
- Eventbrite; I considered adding it to the Outliers as well, because it’s unclear what is going on. Marketing spending increased by $18M YoY, however, revenue remained flat. Was that extra spend needed to keep things flat YoY? There is a reason why most 10-Ks in their risk section include the line: “We may also need to increase our marketing spend in response to increased spend on marketing from our competitors.”.
The Outliers: Robinhood, Peloton & GoPro
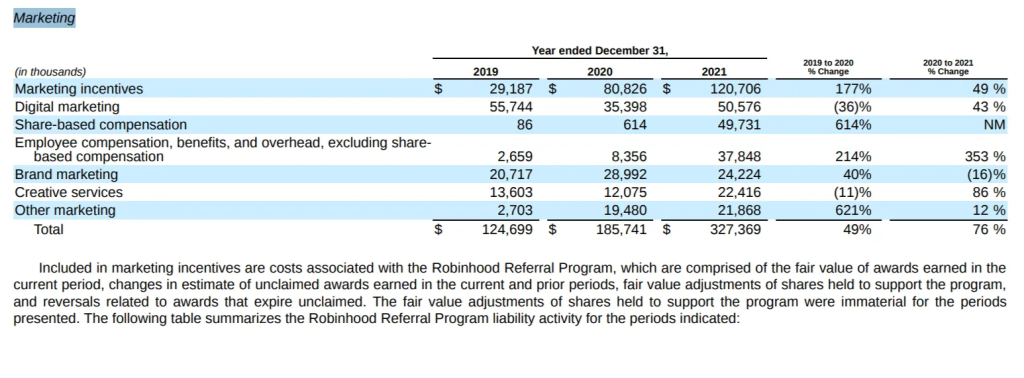
- Fintech Platform Robinhood: Ramped up spending by over 200%, up from $122 million in 2023 to $272 million. But it needs some context, during its rapid growth period in COVID, it was spending $327 million (’21) and $185 million in 2020. With the majority of that being spent on brand & digital marketing. Providing incentives around referrals has declined significantly, from $120 million at the peak in 2021 to $16 million in 2024.
- Peloton: Oh, Peloton, it’s trying so hard but can’t seem to get it right. After spending just over a billion dollars in Marketing in 2022, it has come down 35% to $658 million, keeping up its % of revenue metric (28.4%). The 2025 results will be interesting to watch because after another CMO departure (source) and reorganizing marketing, it’s seemingly dropping its marketing spending significantly.
- GoPro: Its yearly spending has been steady at around $160 million for years. Meanwhile, its revenue has been in decline for years, which is the main reason why its % of revenue percentage grew 50% from ‘21 to ‘24 to 20%.

Other Findings: Restructuring & Indirect Spending
- Restructuring & Impairment causing a change in Operating Expenses: Operating Expenses increased for most companies; many incurred significant restructuring changes in the past couple of years through layoffs or impairments on investments.
- Indirect Spending versus Direct Spending: Expedia is one of the only companies that has split its true marketing spending from the costs associated with those activities. Or as per their definition [source, page #39]: “Selling and marketing – direct costs primarily include traffic generation costs from search engines and internet portals, television and print spending, private label and affiliate program commissions, public relations and other costs. Selling and marketing – indirect costs include personnel and related overhead in our various brands and global supply organization as well as stock-based compensation (SBC) costs.”. If you’re spending above $100 million a year in Marketing (only Eventbrite in this sample spends less at $95 million in 2024, the personnel (+SBC) costs are becoming a limited factor in the total sales & marketing spending.
Methodology
- The financial statements and earnings were retrieved through their earnings reports and filings with the SEC (10-K). In some cases, the company’s fiscal year is not the same as the calendar year so the data could be additional months behind.
- For this year’s analysis, I included a couple of additional consumer brands, including Ziff Davis (tech media company) & Eventbrite (event ticketing).
- The raw data from this research can be found in this Google Sheet.