
What percentage of expenses is acceptable to spend on Sales & Marketing: 4% or 52%. What if I told you that both are acceptable answers? Looking at a few dozen public companies (focusing on consumers, knowing that B2B/SaaS dynamics are even more different), I found interesting answers to these questions.
The quarterly and yearly earnings filings from public companies (submitted to the SEC) provide a good insight into how they think about marketing & sales as part of their financial statements. So I looked at the last earning reports from over 20+ public companies, primarily in consumer technology, to better understand their spend levels.
Findings for Marketing Spend for Public Consumer Companies
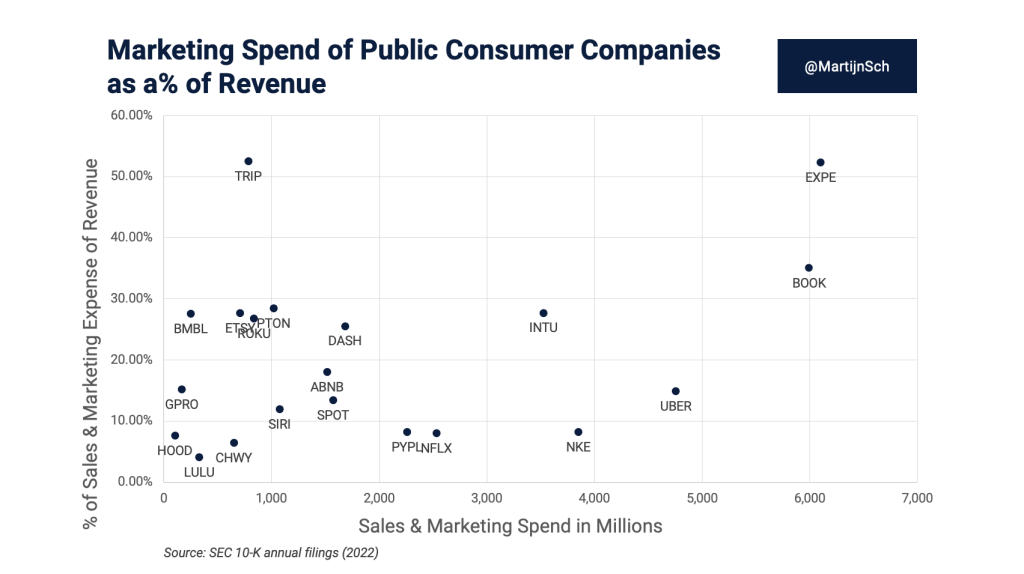
- The average company spent ~20% of their revenue on marketing. However, the cutoff seems to be near 30% as some companies, primarily in travel, increase the average.
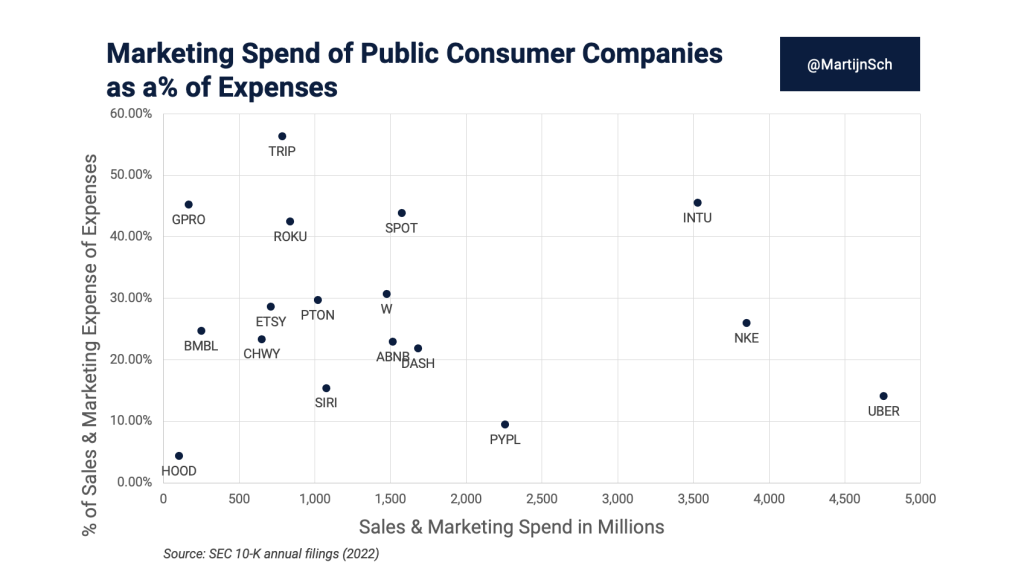
- The average company spent ~16% of their total (operating) expenses on marketing.
- This was, on average, for this dataset, 32% more than in 2021. Companies like Booking.com, Roku, Uber, and Expedia primarily fueled it. Businesses that saw a significant increase in adoption past the COVID-19 spikes of 2020 and 2021.
- Collectively, the companies allocated >42B dollars in 2022 on sales, marketing & advertising spending.

The Outliers
- Travel: Being an executive in travel made me especially curious about the spending levels of OTAs (Booking, Expedia, Airbnb) and other players. And you can see them stand out significantly in the above chart. They’re much higher than other public companies, peaking with TripAdvisor and Expedia just above 50% of expenses going to Marketing. Skift (a travel industry publication) wrote about Booking’s marketing spend here.
- Retail: Chewy, Peloton, GoPro, and Lululemon rank significantly lower as a group based on the simple fact that they’re all selling physical products. This is incurring a lot to produce these goods, which lowers the % of marketing spend.
- Consumer Tech: Robinhood, SiriusXM, Spotify, Paypal, and Netflix are all in lower ranges as well. With varying business models (subscriptions, transactional fees), it seems to be a factor of significant other factors in their business (Netflix > production, PayPal > low processing fees).
Marketing & revenue grew at almost the same pace from ’21 to ’22
- Some things shifted in the metrics from 2021 to 2022. As mentioned earlier, companies like Booking, Expedia, Roku, and Spotify invested aggressively in Marketing. They increased sales & marketing spend by 57.67%, 44.52%, 84.18% and 38.50%.
- For most companies, spending was very much in line with revenue. On average, for this group, the spending grew by 32%, and revenue grew by 33%.
- Uber is one of the most interesting outliers; while revenue grew 80% YoY, their marketing spend remained relatively flat. With CEO Dara Khosrowshahi being one of the first ones in early ‘22 to be vocal (link to his memo) about becoming more efficient, it’s interesting to see what that resulted in for their Sales and Marketing spend.
Methodology & Caveats
To get to the results, we looked at >20 publicly listed companies (in the US) that are either focused on consumer tech or are consumer brands (think Peloton, Airbnb, Nike). We took the last available 10-K from the SEC filings (public record), often in the year 2022. For the comparison, we looked at the same metrics but for the year 2021.
- There is no holy grail for this data. Every company and industry is unique, so saying that you should spend up to x% on average, for example, doesn’t make sense. However, as you can tell from the data, there seem to be some logical boundaries.
- The companies used many different descriptors for marketing/advertising spend.
- The financial statements and earnings were retrieved through their earnings reports and filings with the SEC (10-K). In some cases, the company’s fiscal year is not the same as the calendar year so the data could be additional months behind.
- The raw data from this research can be found in this Google Sheet.